Visualizing an iTwin
Why visualization?
Visualization in digital twins is all about bringing assets to life, which is exactly the purpose of iTwins. The power of iTwin visualization lies in their ability to combine data from various repositories—both internal and external—and present it in a unified, rich context. Imagine being able to visualize sensor data, design elements, and real-world conditions all at once. This not only creates a holistic representation of the asset but also enables dynamic interactions with asset data. From real-time operational monitoring to detailed project reviews, the possibilities are vast and adaptable to many infrastructure domains.
Key scenarios
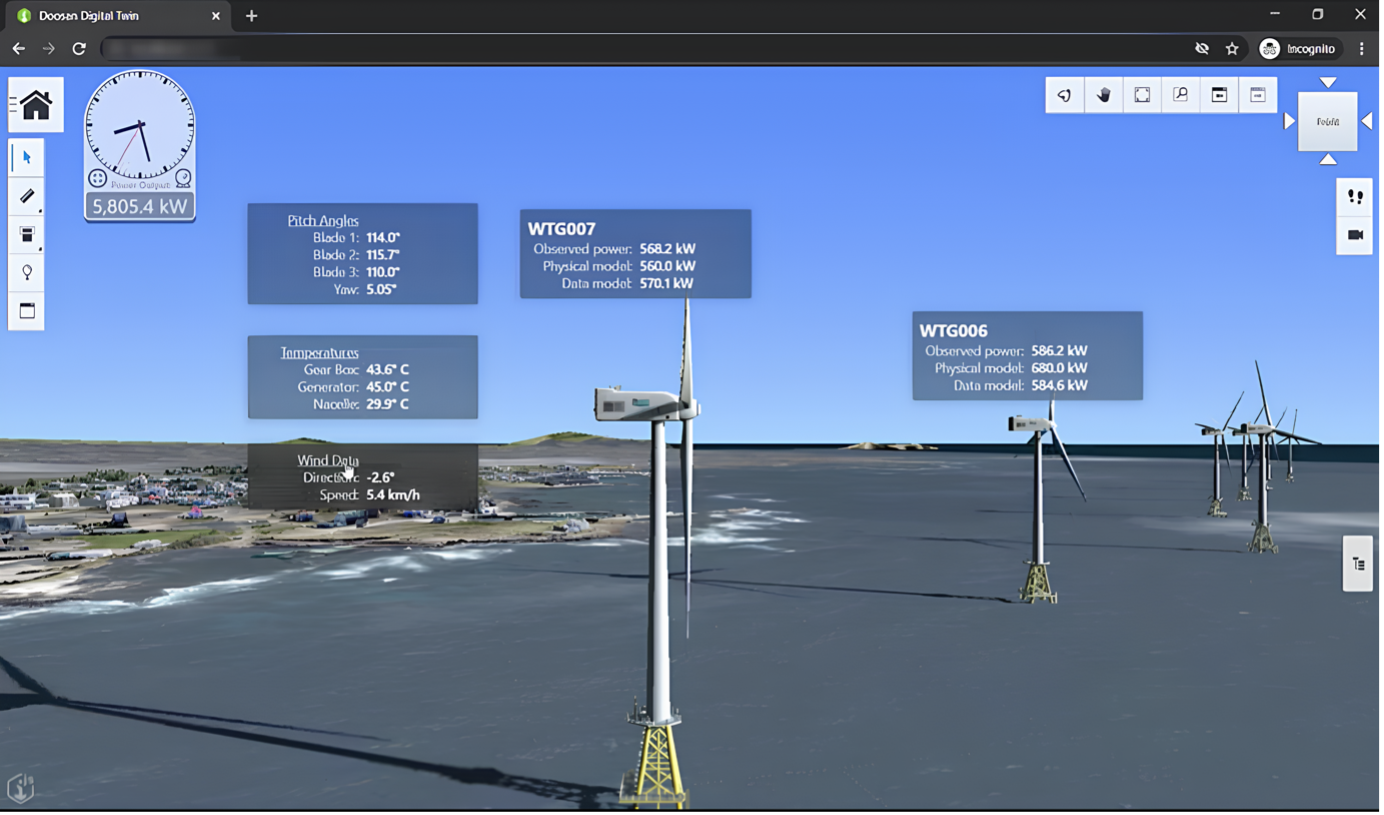
One of the most frequently requested features of the iTwin Platform is their ability to visualize real-time sensor data. This functionality is essential during the operational phase of assets and is also valuable for ongoing design efforts. It allows users to overlay real-time environmental data—such as temperature, occupancy, and other metrics—directly onto the model's elements.
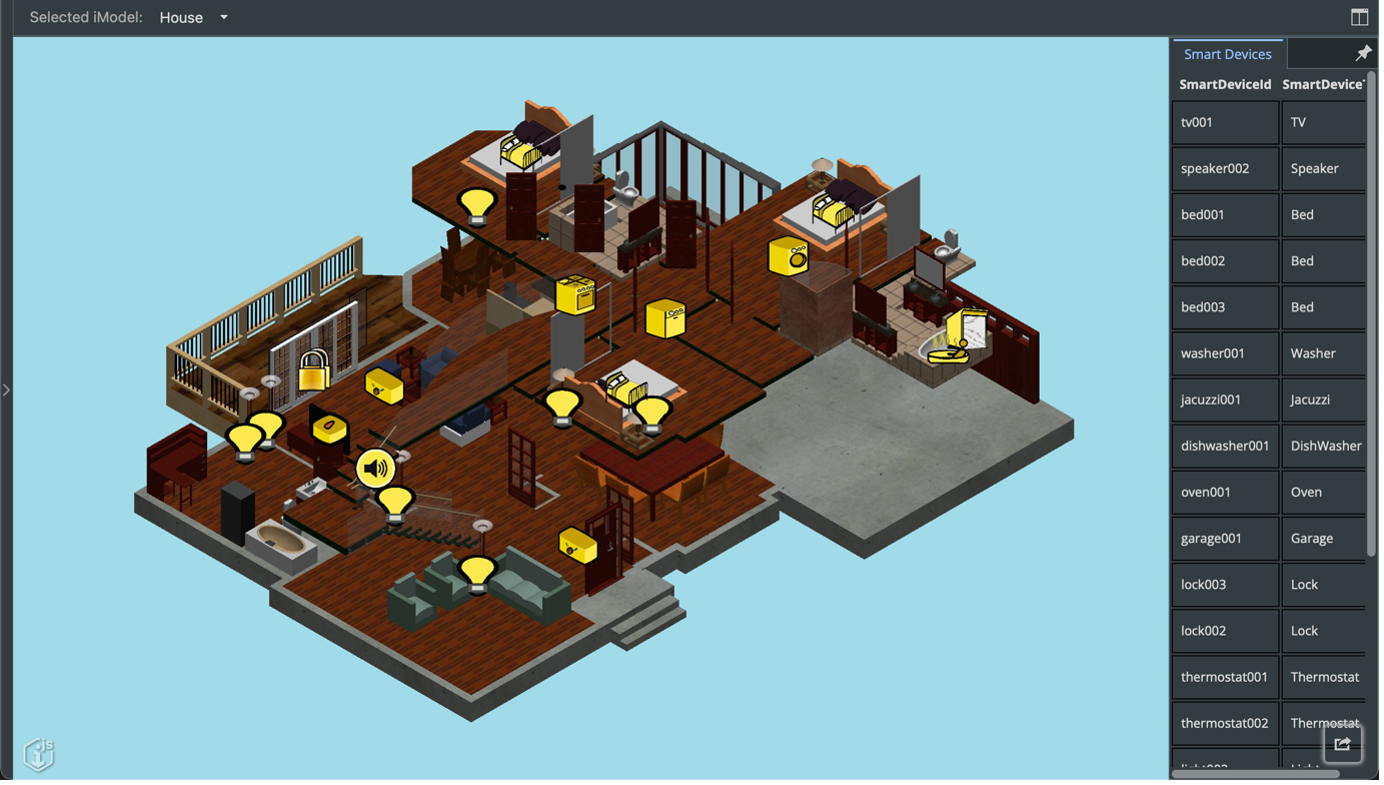
The iTwin Platform offers a variety of visual overlays, including decorators, markers, and annotations, which allow users to enhance their models in numerous ways. These tools are useful for highlighting key areas, visualizing workflows, and incorporating contextual information from external sources like maps or documents.
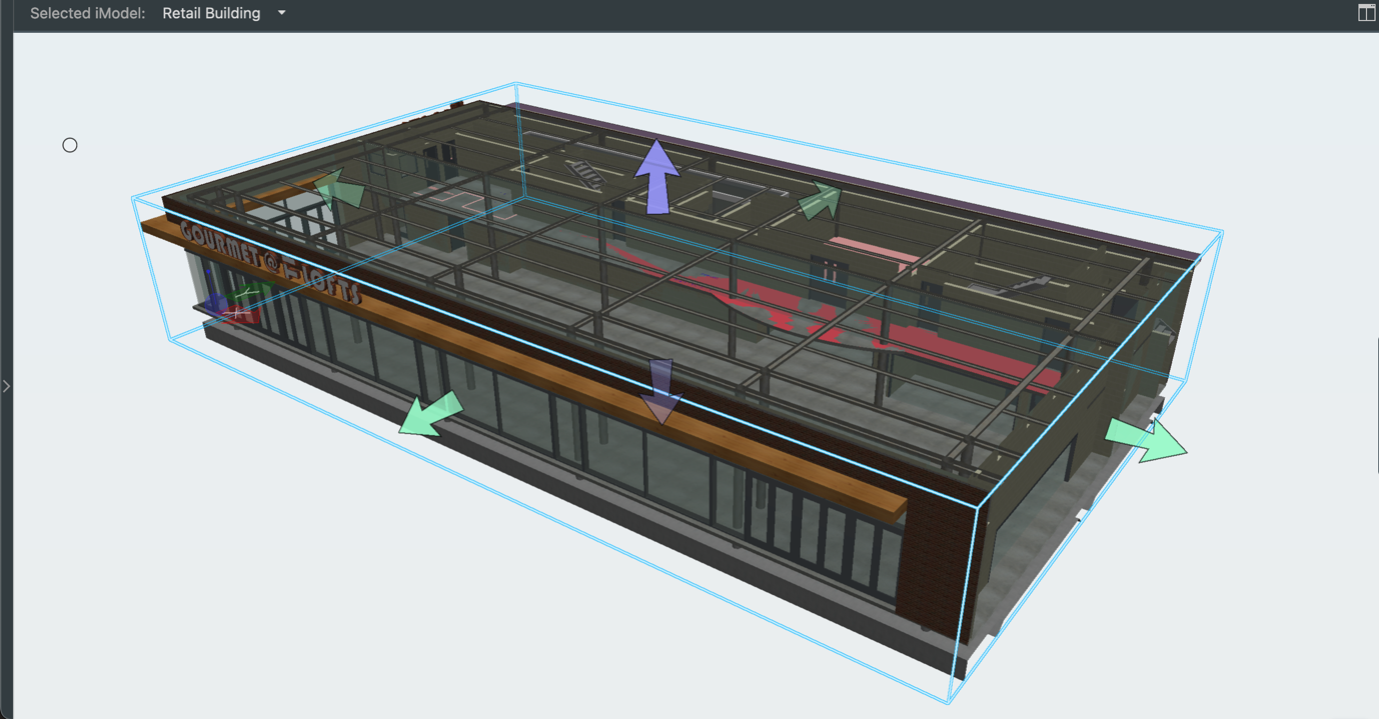
The iTwin Platform goes beyond passive viewing by empowering users to directly interact with the iTwin. This interaction can include fetching element information or creating dynamic tools that extend functionality. By integrating these tools, iTwin applications can deliver custom experiences tailored to specific industry requirements.
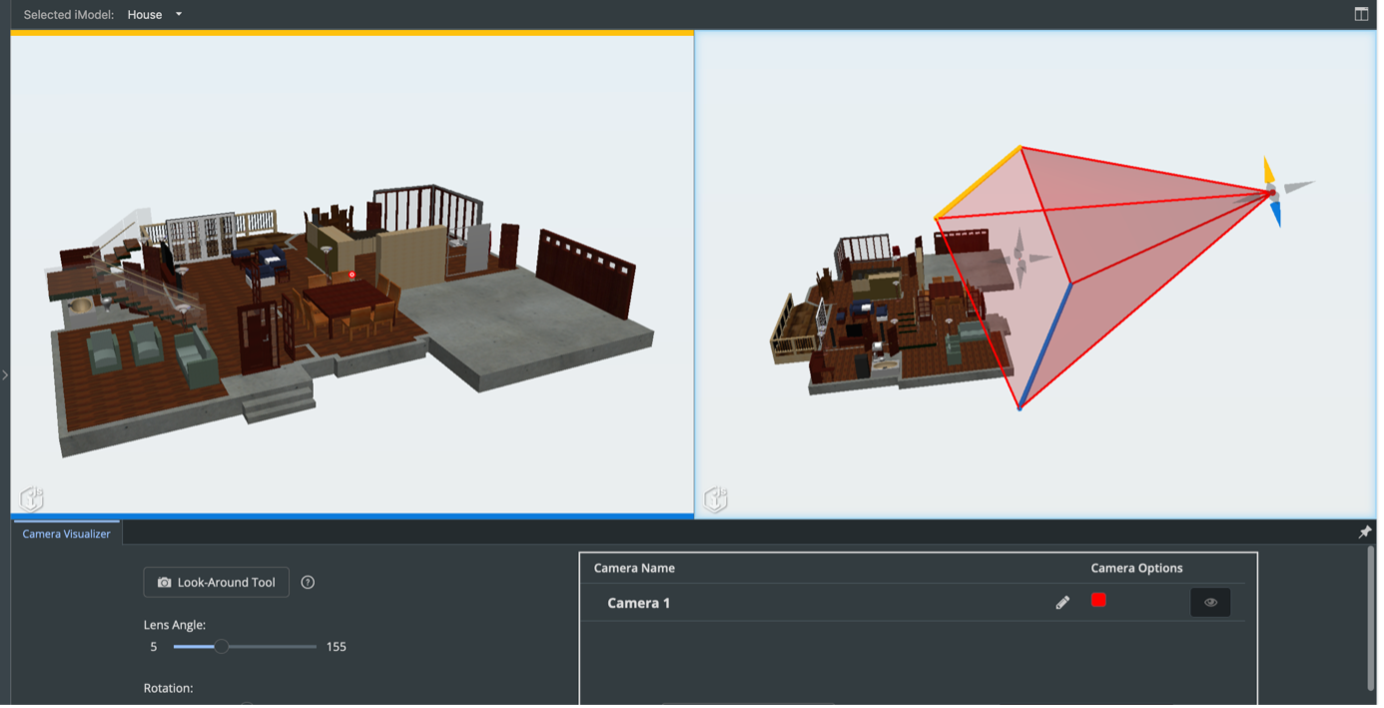
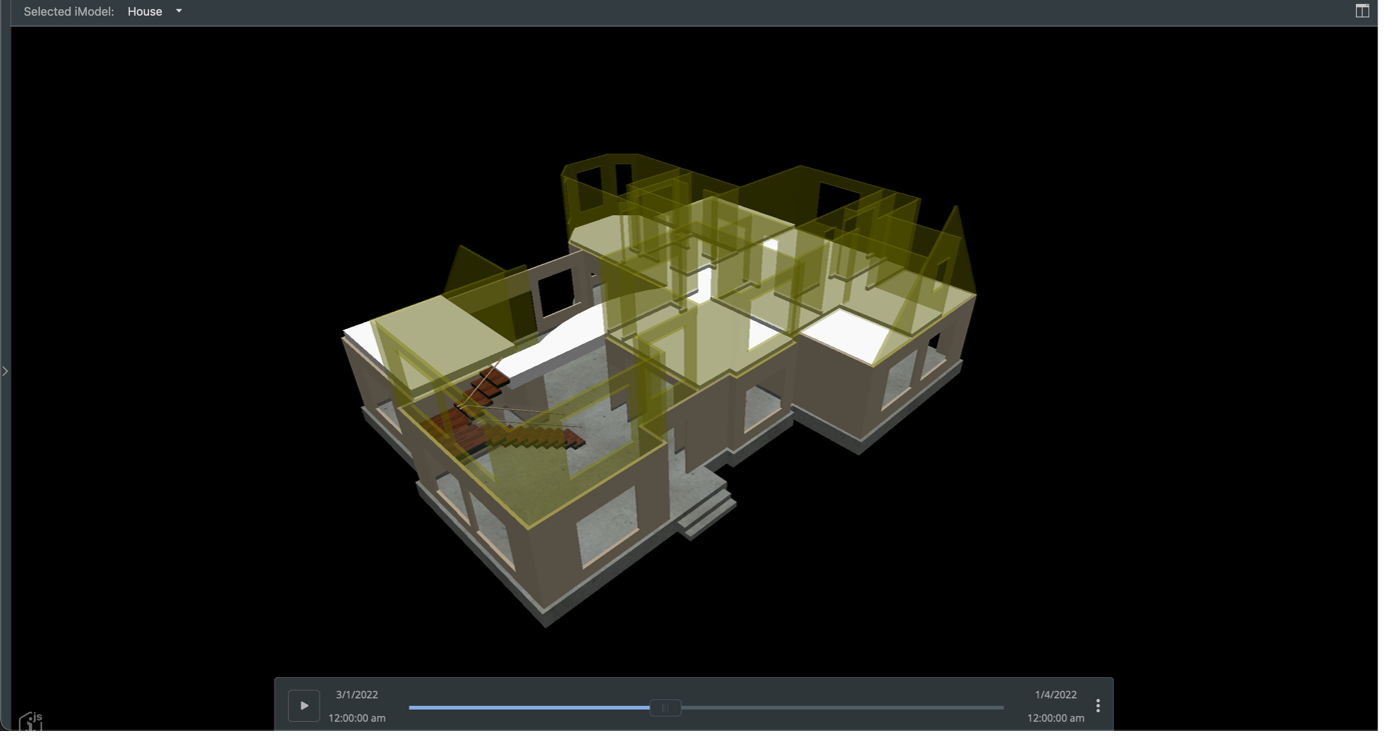
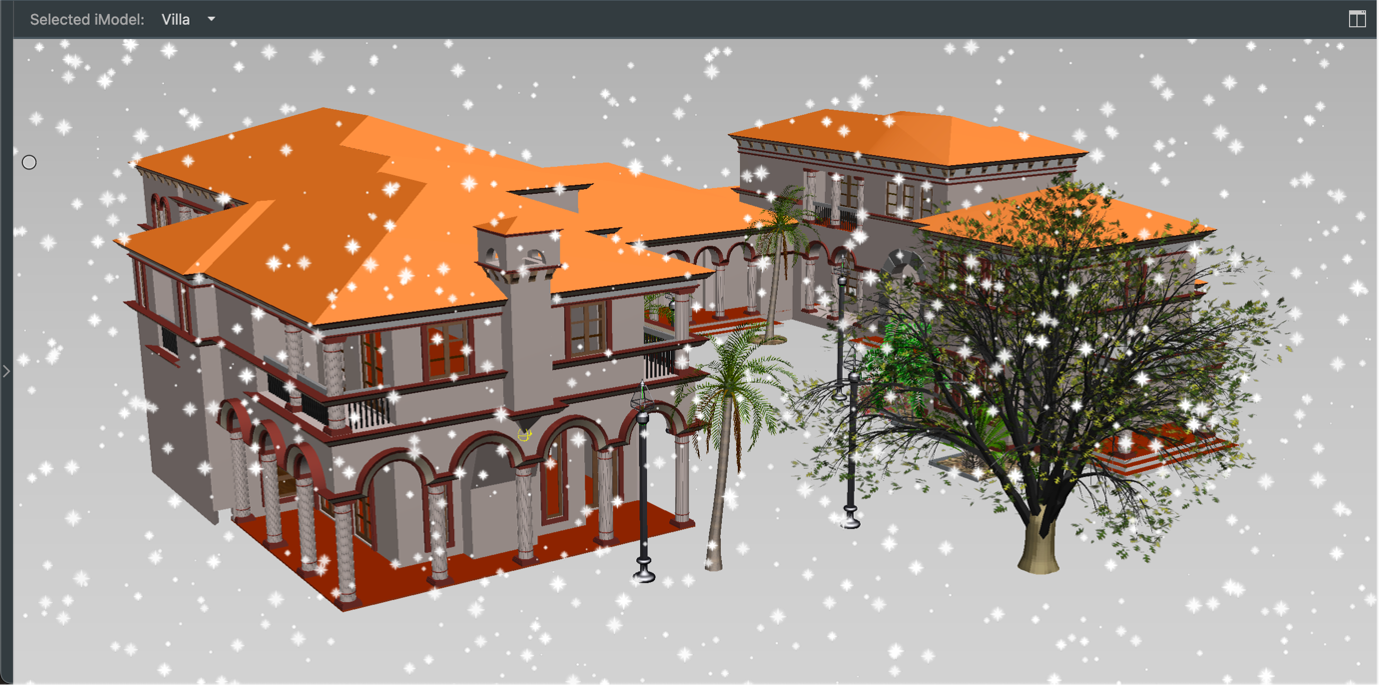
Beyond standard visualization, the iTwin Platform supports advanced techniques such as animations, particle effects, markup tools, heat maps, and more. These features allow users to augment visualization, emphasize important data, or even create animated sequences to simulate real-world scenarios.
Summary
Visualization in iTwins goes far beyond traditional 3D modeling. By combining data from multiple sources and allowing real-time interaction, iTwins provide a holistic view of assets that can be continuously enriched. Whether monitoring sensor data, merging design and reality formats, or developing custom workflows, the iTwin Platform delivers unmatched flexibility. Visualization isn't just about seeing—it's about experiencing your data in new, innovative ways.
Featured tutorials
Was this page helpful?